As Einstein ones said: Any fool can know, the point is to understand. Next to e=mc^2, this is also true when it comes to programming. Learning the syntax of a new language isn’t really hard. But really knowing what’s going on behind the scenes can be a bit harder!
Understanding what your code does becomes even harder when you use what’s called syntactic sugar. Syntactic sugar enhances the syntax of a programming language to make certain things easier to read or write. For example, we all know that x++ means that you want to increase the value of x by one. In reality you say: x = x + 1. But since that’s something we do quite often, language designers have added some syntactic sugar to make this easier.
C# has a lot of syntactic sugar that you probably use every day. In these blog series we will look at the syntactic sugar that C# offers and we will study what’s really going on behind the scenes. This can be in the form of simple sugar, like automatic properties, but also more complex syntax like yield or async and await. By desugaring your code, you can agree with Einstein: you not only know, you also understand!
But first, let’s make sure that we have the right tools to start our journey.
Looking behind the scenes
To understand what’s going on in your code you have to know about Intermediate Language (IL). In languages like C or C++, you compile your program directly for a specific type of processor architecture. This means your compiler will generate assembly language for you.
On the .NET platform however, things are different. Instead of directly compiling to assembly code, you compile to IL. All .NET languages, like VB.NET and F# compile to IL. The .NET framework then takes your IL code and produces machine code that’s optimized for the platform it’s running on. This way Microsoft only has to built one compiler from IL for each platform instead of specific compilers for all languages
You can see what the C# compiler is doing by inspecting the IL code that’s being generated. You can do this by using a tool called Ildasm (Intermediate Language Disassembler). This tool takes your compiled assemblies and shows you the generated IL code. Ildasm is installed on your pc when you install Visual Studio and you can easily open it from a developer command prompt.
Ildasm in action
Take the following example code in C#:
using System;

class Program
{
    static void Main(string\[\] args)
    {
        Console.WriteLine("Hello IL!");
    }
}
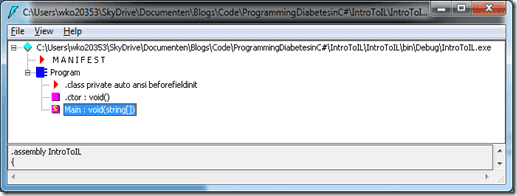
Now you can open the generated assembly in Ildasm which shows you the following:
Your assembly consists of a manifest and the actual code. In this case you can see there is a Program class with a constructor and a Main method. If you open the Main method you will see the generated IL:
.method private hidebysig static void  Main(string[] args) cil managed
 {
  .entrypoint
  // Code size       13 (0xd)
  .maxstack  8
  IL_0000:  nop
  IL_0001:  ldstr      "Hello IL!"
  IL_0006:  call       void [mscorlib]System.Console::WriteLine(string)
  IL_000b:  nop
  IL_000c:  ret
} // end of method Program::Main
Although it’s a little hard to read when you’re not used to it, you can see the important concepts of your C# program in this IL code. Line 1 declares your Main method and on line 8 you see the call to Console.WriteLine. Since this program was compiled in debug mode you also see a couple of nop instructions (line 6 and 9). Nop stands for no-operation. These instructions are added by the compiler to make debugging easier. When compiling your program in release mode, those instructions will be removed.
dotPeek
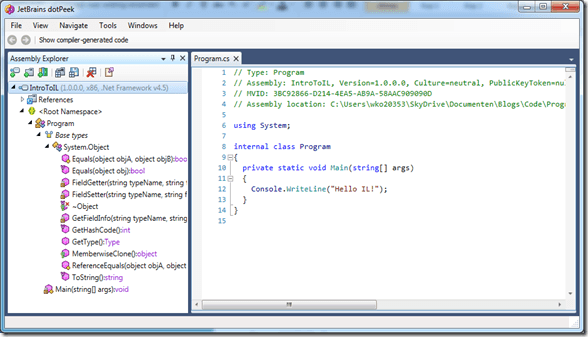
When your program grows larger and more complex, manually inspecting the IL code is not the easiest thing to do. Fortunately there are other tools that can help. One such tool is dotPeek by JetBrains (the company who also creates ReSharper).You can download dotPeek for free at http://www.jetbrains.com/decompiler/. If you now open your generated assembly in dotPeek the IL code will be decompiled into C# so you can easily read it:
Armed with these tools you can now start inspecting your own code but also the .NET framework code to see what’s really going on behind the scenes.
Do you ever think about syntactic sugar? Have you used Ildasm or dotPeek? Or do you have another favorite tool? Please leave a comment!

