“When you can measure what you are speaking about, and express it in numbers, you know something about it, when you cannot express it in numbers, your knowledge is of a meager and unsatisfactory kind; it may be the beginning of knowledge, but you have scarely, in your thoughts advanced to the stage of science.” ― Lord Kelvin
Being able to measure what you’re doing and putting it into numbers is the first step to improvement. This is absolutely true for DevOps and one of the big reasons why the DORA metrics are so popular. Measuring those four metrics and improving upon them will help you become a high performing team.
I’m currently working with a large enterprise user of Azure DevOps and working on improving their usage of Azure DevOps. One of the things they struggle with is the duration of their pipelines. CI/CD is extremely important when it comes to DevOps but you can imagine that waiting 6 hours in the queue before your build runs and having builds that take multiple hours is not what you want. Because of the size of their code base, the use of third-party software in their pipeline and integration with their private network, they are using private build, test and release agents. Optimizing their agent usage is far from trivial since they have thousands of pipelines spanning multiple technologies.
Lately we’ve been building a fully scalable, automatically updating set of private agents. The agents continually monitor the workload and scale up and down according to demand. When updates to the agent software are required, a new image gets generated and is gradually rolled out to avoid down time. Now we want to optimize this even further and make sure we have the optimal number and size of agents.
Questions
Some of the questions we want answered:
- Do we have enough agents? Should we have more for certain peak times? What about during the night or the weekend?
- What’s the right VM size for the agents? Do certain workloads need a larger VM?
- What is the queue size and queue duration? Are jobs waiting before they start?
- Is our scaling fast enough? What thresholds should we set?
Having faster pipelines helps engineers get quick feedback and will lead to a faster lead time and higher deployment frequency. However, this needs to be balanced with costs. Spinning up enormous amounts of agents and letting them sit idle is a waste of money. The same is true for pipelines that are so inefficient that they require a huge amount of resources and force you to scale up or even add agents while others are waiting in the queue.
Now that we have solved the largest issues I started looking into these questions and fortunately Azure DevOps offers more and more information to answer these questions.
Getting the data
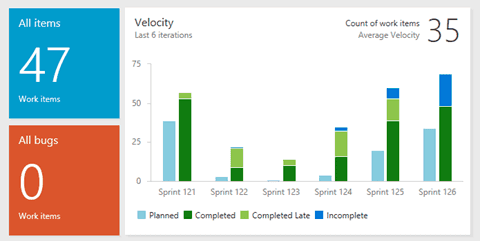
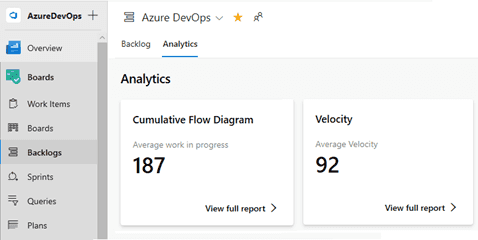
Azure DevOps offers an Analytics service. This service is part of Azure DevOps and contains a large set of historical data that you can query and use to build reports. The Analytics Service is still growing. At the moment data around work items and pipelines is present. The Analytics data powers some of the new widgets and in-context reports that start showing up in Azure DevOps.
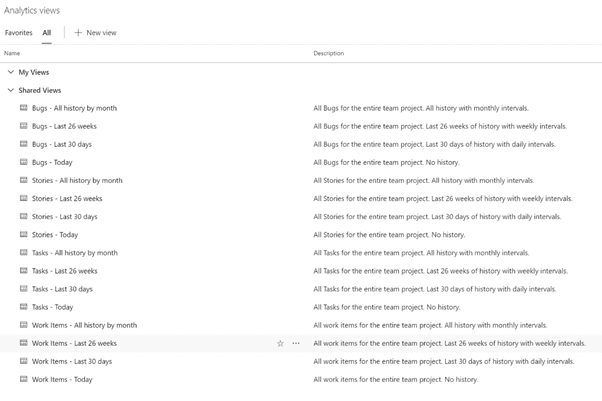
The Analytics service contains a lot of data. Although the service is optimized for reading large amounts of data and doing server-side queries, running a query against all the data in a large organization is not feasible. For work item data, Microsoft has added Analytics Views. Those views take a subset of the data (bugs in the last month, new work items in the last week) and expose those so you can build reports on them.
For pipeline data, you can’t use the analytics views and will have to use the underlying data technology through the Analytics endpoint.
Analytics endpoint
The Analytics endpoint is an OData endpoint that you can write OData queries against and get exactly the data you want in the shape you need. OData stands for the Open Data Protocol and is a standard way of accessing REST APIs. OData allows you to build complex queries as a URL. You can add elements like $select, $count, $aggregate and other operators and send them as an HTTP request to Azure DevOps and get the results in JSON.
OData basics
Azure DevOps uses a versioning mechanism to expose the different data sets. Version 1 and 2 are already out of preview and contain the work item data. Version 3 adds build pipeline data.
https://analytics.dev.azure.com/{organization}/_odata/v1.0/ https://analytics.dev.azure.com/{organization}/_odata/v2.0/ https://analytics.dev.azure.com/{organization}/_odata/v3.0-preview/
If you navigate to https://analytics.dev.azure.com/{organization}/_odata/v3.0-preview/$metadata you get a rich description of the available data and the names of all entities and properties. I often use this to orientate myself and find the entities and properties I want.
As a simple example, take this URL: https://analytics.dev.azure.com/{organization}/_odata/v3.0-preview/BuildPipelines/$count. This query returns the number of build pipelines in the organization.
A more complex query returns all YAML based pipelines per team project:
And this query will show the number of runs each designer build definition had since 4/1/2019 grouped by team project.
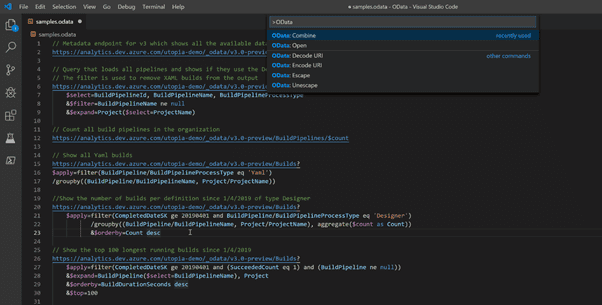
Making sense of those very long encoded URLS is not something you want to do by hand. Fortunately, VS Code helps you with an OData extension that lets you write the queries in an easier syntax, open them in the browser and convert them to a URL:
Another extension that will help you work with OData is this plugin for Google Chrome that renders the JSON in a nice format: https://chrome.google.com/webstore/detail/jsonview/chklaanhfefbnpoihckbnefhakgolnmc?hl=en.
For more information about OData and the OData query language see https://www.odata.org and https://docs.microsoft.com/en-us/azure/devops/report/extend-analytics/?view=azure-devops
REST APIs
Since not all data is available yet in the Analytics service, I’ve ended up writing some PowerShell scripts to extract data through the Azure DevOps REST APIs and write the results to a JSON file. For example, I created a script that loops through all the build definitions in all the team projects and exports the agent pool that’s used in every phase. That way, I can see how builds are distributed across our pools and inform the team on who has to be migrated before they can shutdown older pools.
Here is a snippet of the data:
[
   {
      "Name": "definition name",
      "Id": 5161,
      "ProjectId": "21780cd2-d3f3-4212-bd4b-e98f45cce3a6",
      "ProjectName": "project name",
      "QueueId": 293,
      "QueueName": "queue name"
   },
   ...
]
Visualizing the data with Power BI
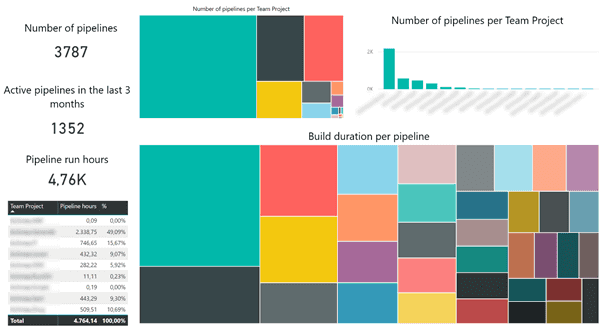
A bunch of JSON, be it in the browser or in a file, doesn’t make for a nice report. Fortunately, this is where Power BI shines. After some configuration stuff I came up with the following report (I’ve blurred some data and removed the labels of the tiles in the tree maps since I can’t share the actual names):
Several things stand out: there are way more pipelines then there are active pipelines. Apparently, it’s time for a big house cleaning. You can also see that one team project uses 49,09% of all the build pipeline hours! When looking at the duration per pipeline, the first pipeline 9 pipelines take up more than half of all capacity. That’s shocking!
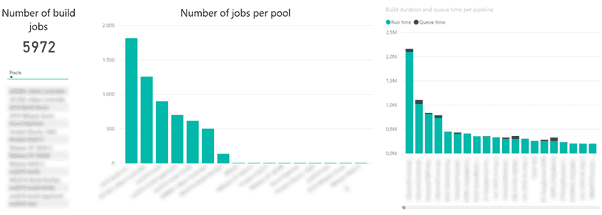
Based on the JSON data I created the following report to show the distribution of build definitions and jobs across the pipelines. I also created a graph showing the run vs queue time of the build definitions:
Since a lot of builds use multiple jobs targeting multiple pools, there are more jobs then there are build definitions. As you can see, the largest pool has around 1800 jobs running on it. If I tell you that pool is one of the older pools that needs to be deprecated you can understand a lot of teams are going to need some help and enticement.
The graph on the right shows the queue and run time. Since we implemented auto scaling of the agent pools, people have complained that agents are always offline when they want to do something. Of course, we will always need to tweak the scaling but looking at the very small queue time on top of the run time bars, I think we’re ok for now.
How did I create those reports?
When using Power BI, you can connect directly to an OData feed or you can create your own OData query. Since the dataset is enormous, I couldn’t directly load the OData feed. It took forever before Power BI downloaded all the data. Fortunately, [Microsoft added a great page to their documentation](https://docs.microsoft.com/en-us/azure/devops/report/powerbi/sample-odata-overview?view=azure-devops “Microsoft added a great page to their documentation”) showing how you can use OData queries to directly load only the data you need.
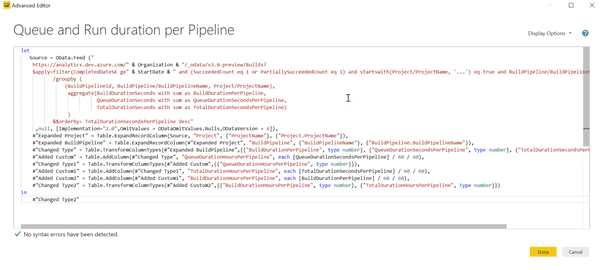
The following screenshot show the advanced editor of a Power BI query where I used an OData query to load the data:
I started out with the following query:
let
   Source = OData.Feed ("
    https://analytics.dev.azure.com/" & Organization & "/_odata/v3.0-preview/Builds?
    $apply=filter(CompletedDateSK ge" & StartDate & " and (SucceededCount eq 1 or PartiallySucceededCount eq 1) and startswith(Project/ProjectName, '...') eq true and BuildPipeline/BuildPipelineName ne null)
           /groupby (
               (BuildPipelineId, BuildPipeline/BuildPipelineName, Project/ProjectName),
                aggregate(BuildDurationSeconds with sum as BuildDurationPerPipeline,
                          QueueDurationSeconds with sum as QueueDurationSecondsPerPipeline,
                          TotalDurationSeconds with sum as TotalDurationSecondsPerPipeline)
                )
           &$orderby= TotalDurationSecondsPerPipeline desc"
     ,null, [Implementation="2.0",OmitValues = ODataOmitValues.Nulls,ODataVersion = 4])
in
    Source
The other lines where added by Power BI when I started renaming columns and added some custom columns. For example, the default timespans are returned in seconds. Those numbers where so large that I converted them to hours (s / 60 / 60) to get some more reasonable numbers to work with.
I also parameterized the query for Organization and StartDate to make it easier to maintain and change.
The JSON query starts with pointing Power BI to the JSON file and then converting it to a table and defining the individual columns:
After you have the queries, I often first create a basic table just showing me the data. Then I decide on an appropriate visualization. In the reports above I used simple cards to show numbers, a table to list some data, treemap to show relative sizes (in the hopes of encouraging people to improve if their build is a really big tile!), and some general bar graphs.
Next steps
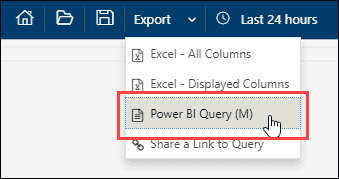
I am by no means a Power BI expert and I will definitely play around with it more and see what other gems it offers. I’ll also continue thinking about the questions I want to ask my data. For example, instead of the number of jobs targeting a pool, what is the runtime per pool? What’s the average queue time? Does it improve over time?
And I want to connect more data sources. I’ve already experimented a bit with Azure Log Analytics. We log all our scaling metrics to Application Insights. Every five minutes an Azure Function runs and looks at each pool and logs information such as queue size, number of enabled, offline, idle and busy agents and then decides on scaling the pool. All this information is visualized on dashboards in Azure but Log Analytics has a nice and simple Export to Power BI button!
This would allow me to enhance the Power BI reports and combine data around the number of available agents and queue and build time.
Azure Cost Management can also be integrated with Power BI. I already created some reports showing the costs our agent pools over time. It’s really cool to see how tuning the scaling algorithms saves us money! Now I want to integrate this with the data on pipeline durations so I can say how much each pipeline costs us and use it to automate creating the invoices that go to every department.
And of course, I’m waiting for more data to become available in Analytics, especially around releases and multi stage pipelines.
For now, I’m happy with my report and I’m looking forward to learn more about Power BI and OData and help customers implement the DORA metrics!
